Reading Candlestick chart Patterns is like reading a book written in foreign language. You can flip the pages but you will not be able to find WTF is written in it.
The stock market communicates through Japanese candlestick patterns and if you spend some time in learning that, you will be able to read the market without any problem.
People say that market is unpredictable and something new happen every time. We should always think that every trade is different and unique.
However, there are certain patterns that repeats most of the time. Now, the question is, how can we spot those repeatable patterns. The answer is, by looking at candlestick charting patterns that tells us the whole story.
Type of Candlestick Chart Patterns
#1. Hammer
The most reliable and clearly visible candlestick pattern that is formed after a bearish(down) trend. It indicates that bears have gone with their final move and now bulls are coming to push the price at a higher level.
Generally, this candle is of green or white color but if a similar candle of red or black color is forming after downtrend then it will be also considered as a bullish reversal signal.

Anatomy: Small upper body with long lower wick/shadow and no upper wick. The shape resembles an actual hammer. Sometimes a very small wick is formed with long lower wick, that will also be considered as a hammer.
The psychology behind the formation is that bears tried their best to pull down the prices but before the closing time, Bulls were able to push back the price to higher CMP than the previous day closing price.
#2 Bullish Harami
In Japanese, Harami means a ‘pregnant woman’ and the harami candlestick looks exactly similar to a pregnant lady. It is a trend reversal candle that is formed after the end of a downtrend and indicates a bullish reversal.
It is not a single candlestick but a combination of two candlesticks. The first candle shows that the bears are controlling the market while the formation of a small green candle with no upper or lower shadow indicates that bulls are coming soon.
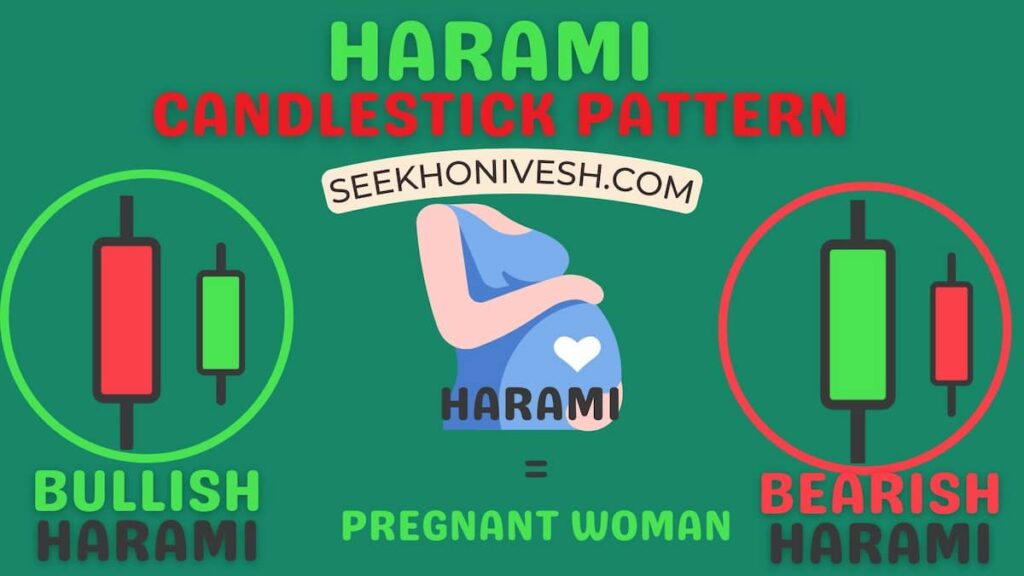
Anatomy: When a long-bodied bearish candle is formed on the first day. On second day, a small green candle is formed in the middle area of a large red candle with a gap up opening. A tall bearish candle of red color is formed followed by a small bullish green/white candle as shown in figure.
The psychology behind the pattern is that the strong downtrend pulling the price to lower lows until the formation of a final tall red candle. On the following day, the smart money comes into action and doesn’t allow the price to fall further. The gap up opening indicates the presence of strong buyer in the market.
#3 Bullish Engulfing
This chart pattern is just the opposite of harami pattern. So, if you know harami candle combination then you know this too. It is the combination of two types of candlesticks and signals a bullish reversal.
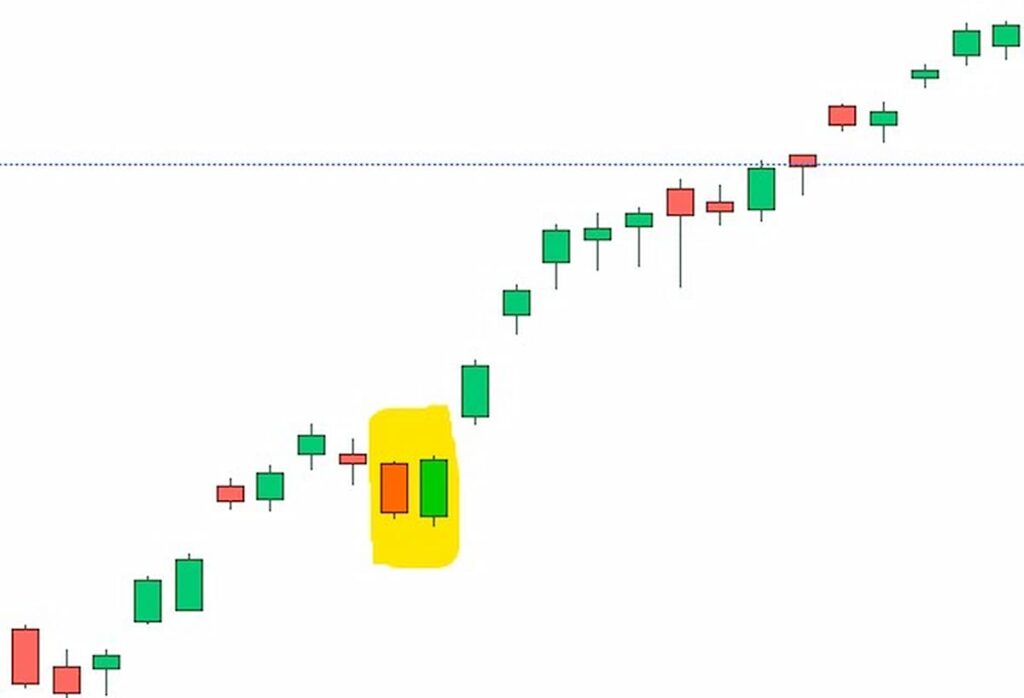
It forms after the end of Bearish trend. A large green bodied green candle that completely engulfs the previous day bearish candle shows the dominance of buyers in the market. This shows that bulls are back with more firepower.
Anatomy : A red bodied candle is formed on the first day with no shadow. On the following day, market opens with gap down but during the closing session of Nasdaq, buyers pushed the price to the day’s highest and even surpass the previous day red candle.
The psychology is simple. Buyers were not active at the opening time of market and selling pressure was on as indicated by gap down opening. However, as the session progressed, buyers showed up and push the price to the higher high engulfing the little sellers.
#4 Marubozu
Of all these candlestick patterns, Marubozu is the one candle that can signal both a trend reversal and a trend continuation. The Japanese word marubozu means primacy.
For example if a stock is falling for three consecutive days then bears dominate whereas if a stock is rising continuously for three days then bulls dominate. However, from this we cannot know what will happen on the fourth day.
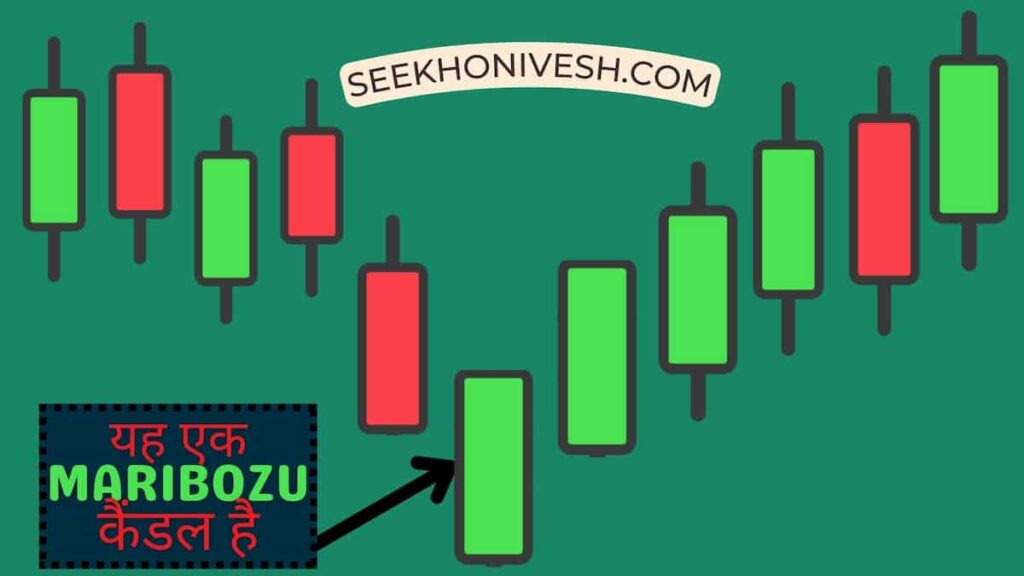
Anatomy: If the upper and lower shadows are missing in a green candle, it means that the bulls are continuously buying the stock and they want to buy the stock at any price.
Without going down even a centimeter from the price at which the stock opens, it closes higher than yesterday’s price. It appears that investors want to buy the stock and add it to their portfolio in any case.
#5 Three White Soldiers
When the price of a stock continues to rise for three consecutive days, there is a high probability that the stock will continue the same pattern in the future. If only this type of candle is formed as shown in the example then the pattern is confirmed but most of the times a candle is formed which looks like a hammer.
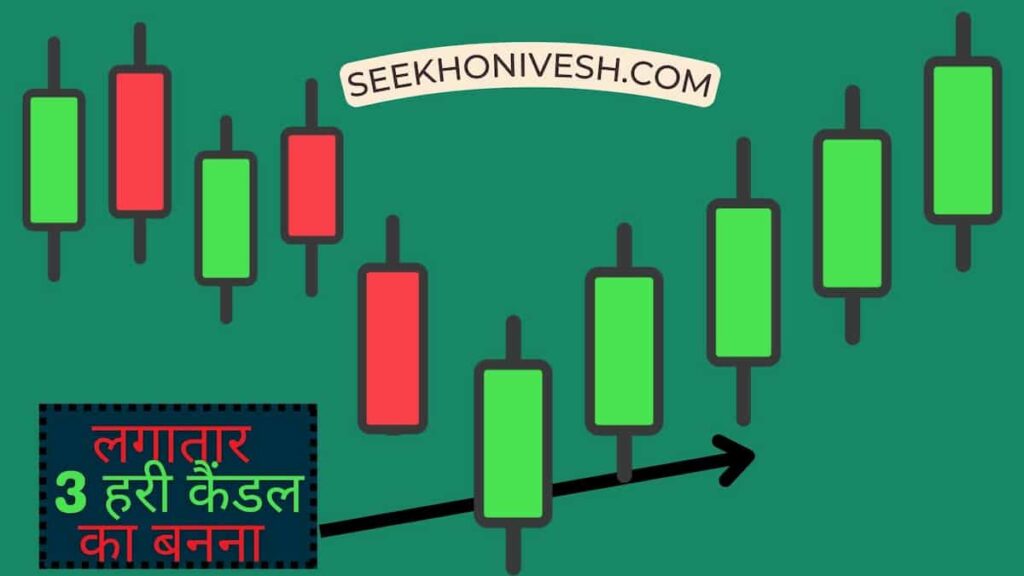
Although they are also a part of this pattern, but by looking at them, you cannot tell how long the share price will continue to rise. Maybe from the day you buy the stock, it starts falling. This often happens to those people who invest money without understanding the mathematics of share market, so first earn knowledge and money and do not commit the sin of trading by taking loan.

